

Reference
◆Excel:Financial Data Book1.Consolidated Business Results (FY2025)
| Net Sales | ¥141,144M | (+2.7%YoY) |
|---|---|---|
| Operating Profit | ¥7,345M | (+4.7%YoY) |
| EBITDA | ¥10,446M | (+3.2%YoY) |
| Ordinary Profit | ¥7,197M | (+7.0%YoY) |
| Net Income | ¥3,740M | (-5.6%YoY) |
- Net Sales
-
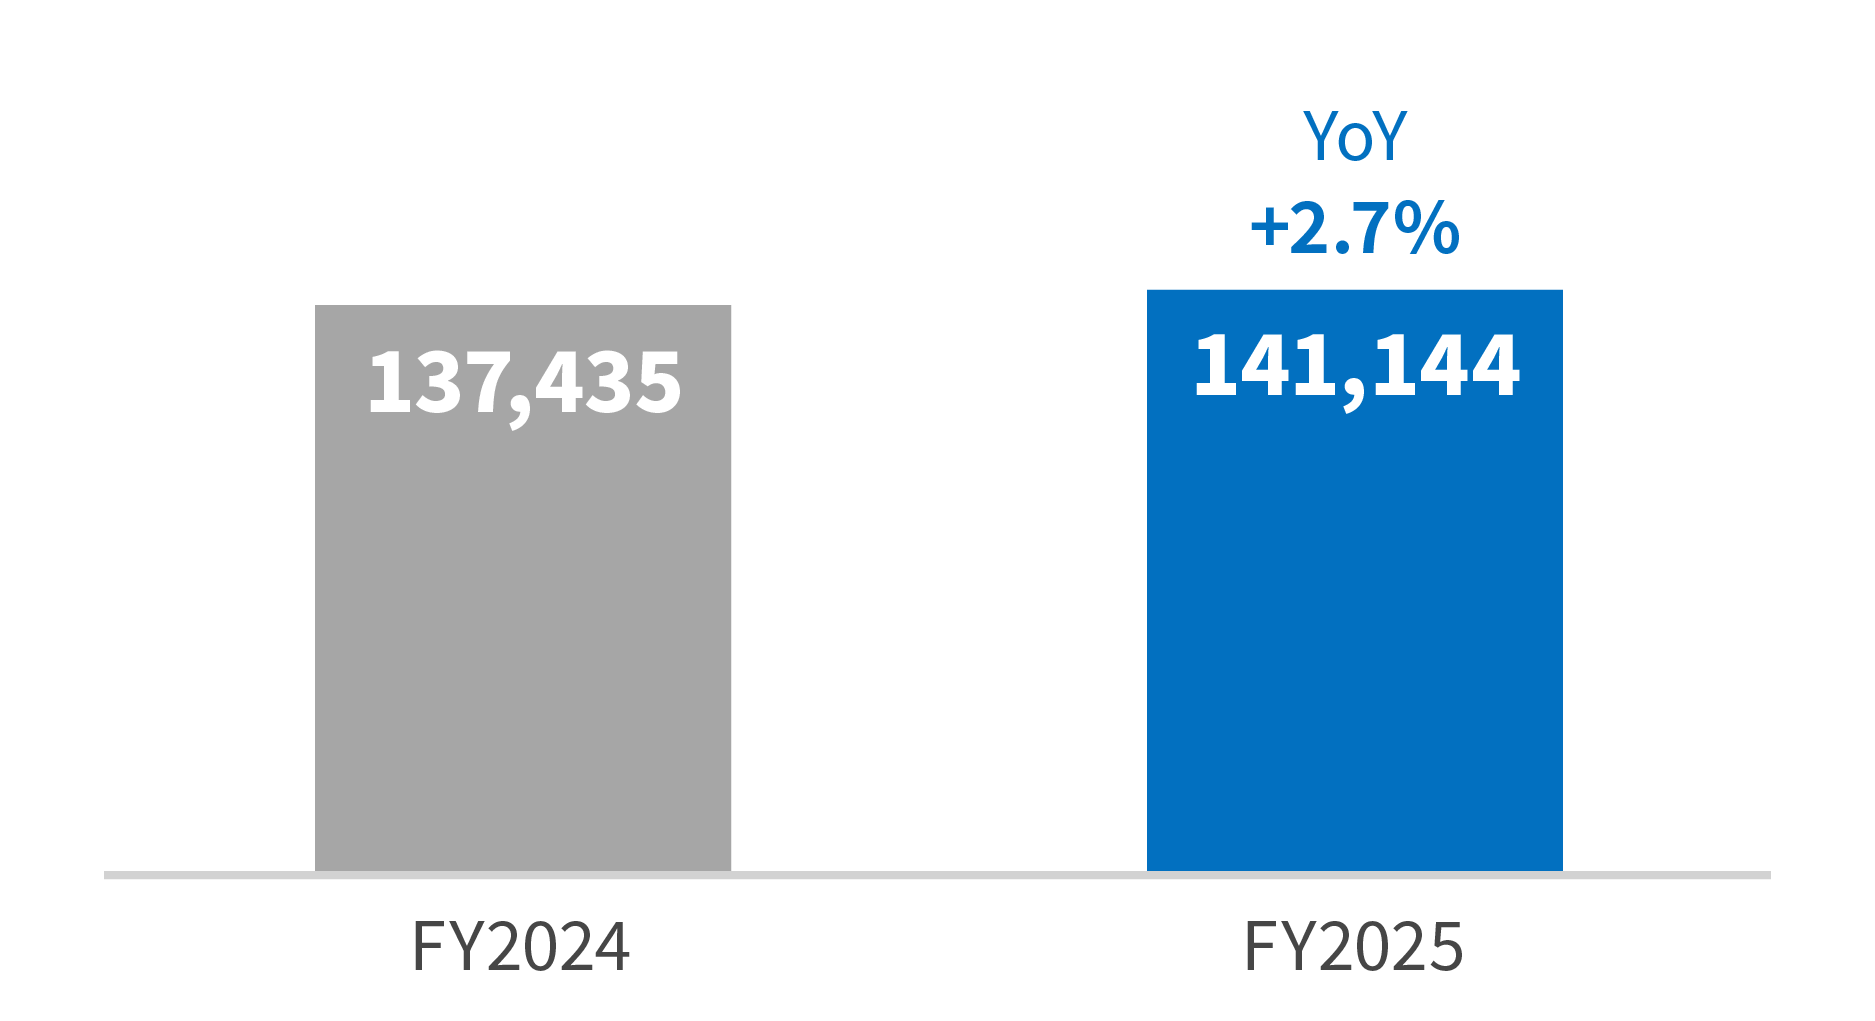
Net sales for FY2025 increased 2.7% year on year to 141,144 million yen, primarily due to the effect of price revisions in the Medical Business, as well as solid performance in both the Elderly Care Business and the Children Business.
- Operating Profit
-
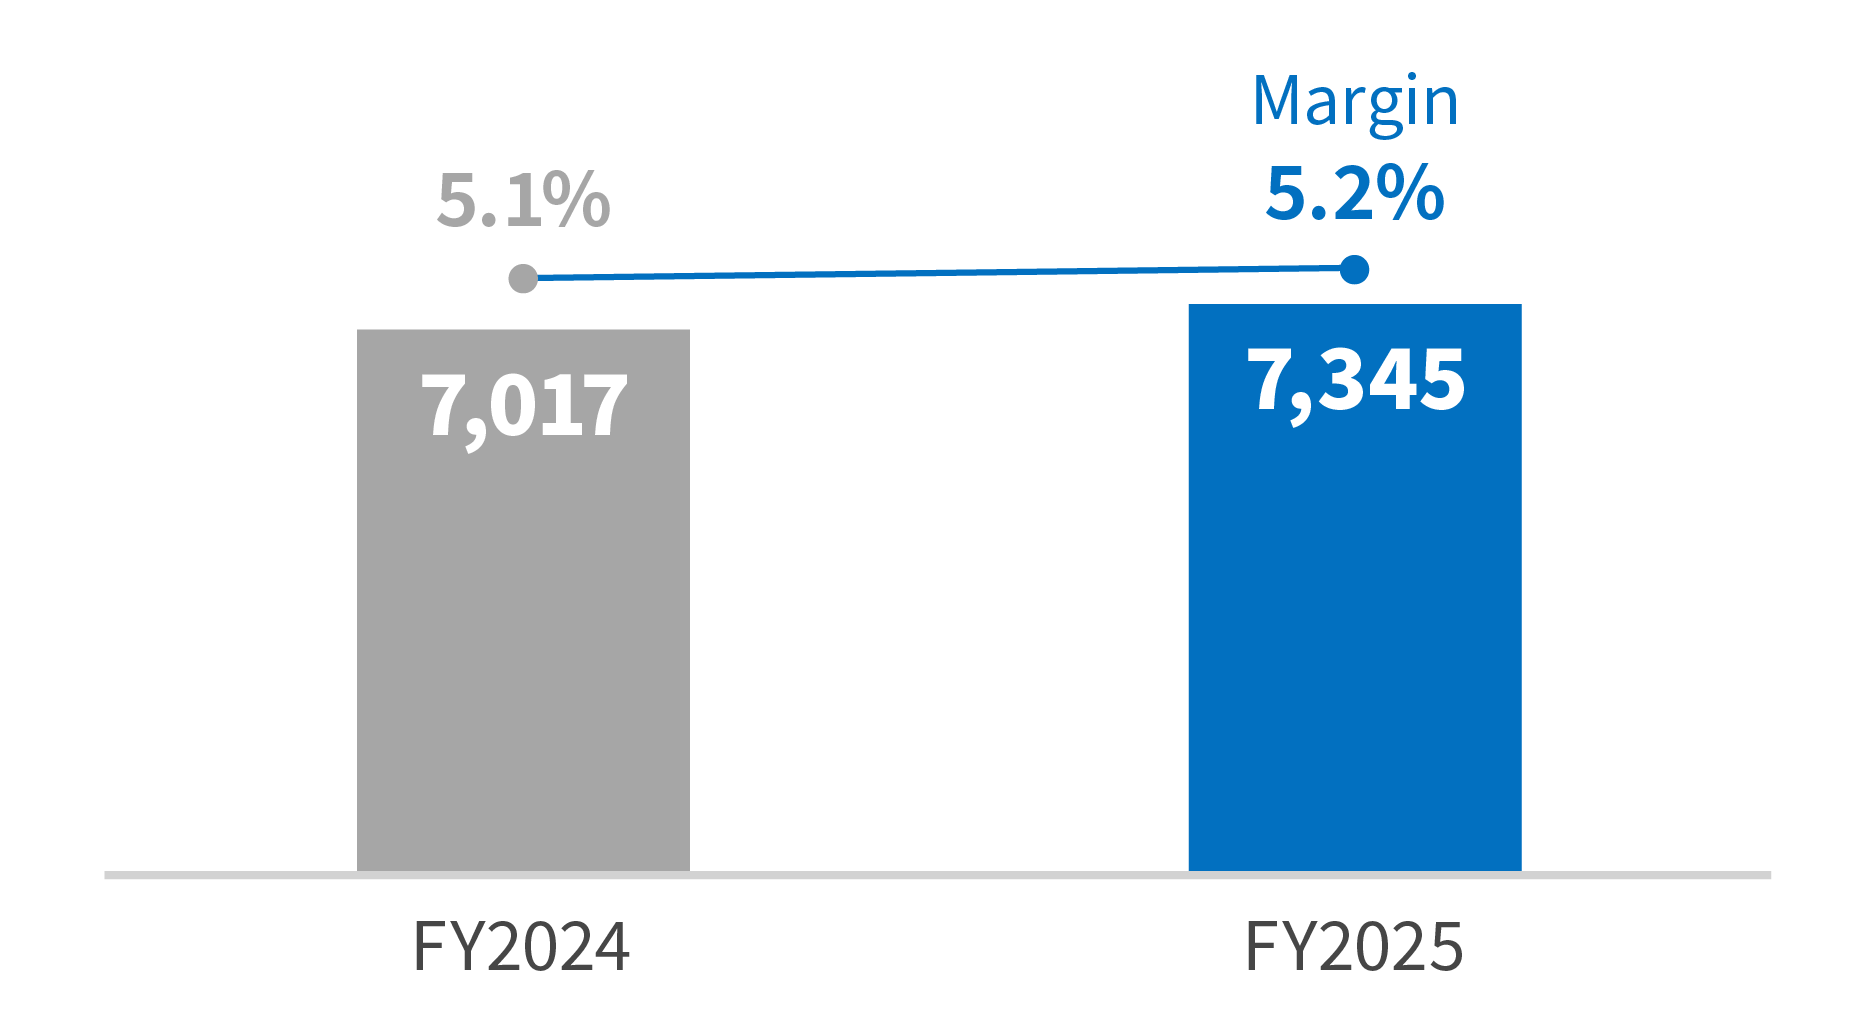
Regarding operating profit, we further strengthened strategic improvements in employee treatment for future growth beyond the initial plan and executed new IT investments as planned. Despite these proactive up-front investments, operating profit increased 4.7% year on year to 7,345 million yen, reversing the initial forecast of a profit decrease, thanks to the effects of price revisions in the Medical Business and steady growth in the Elderly Care Business.
- EBITDA
-
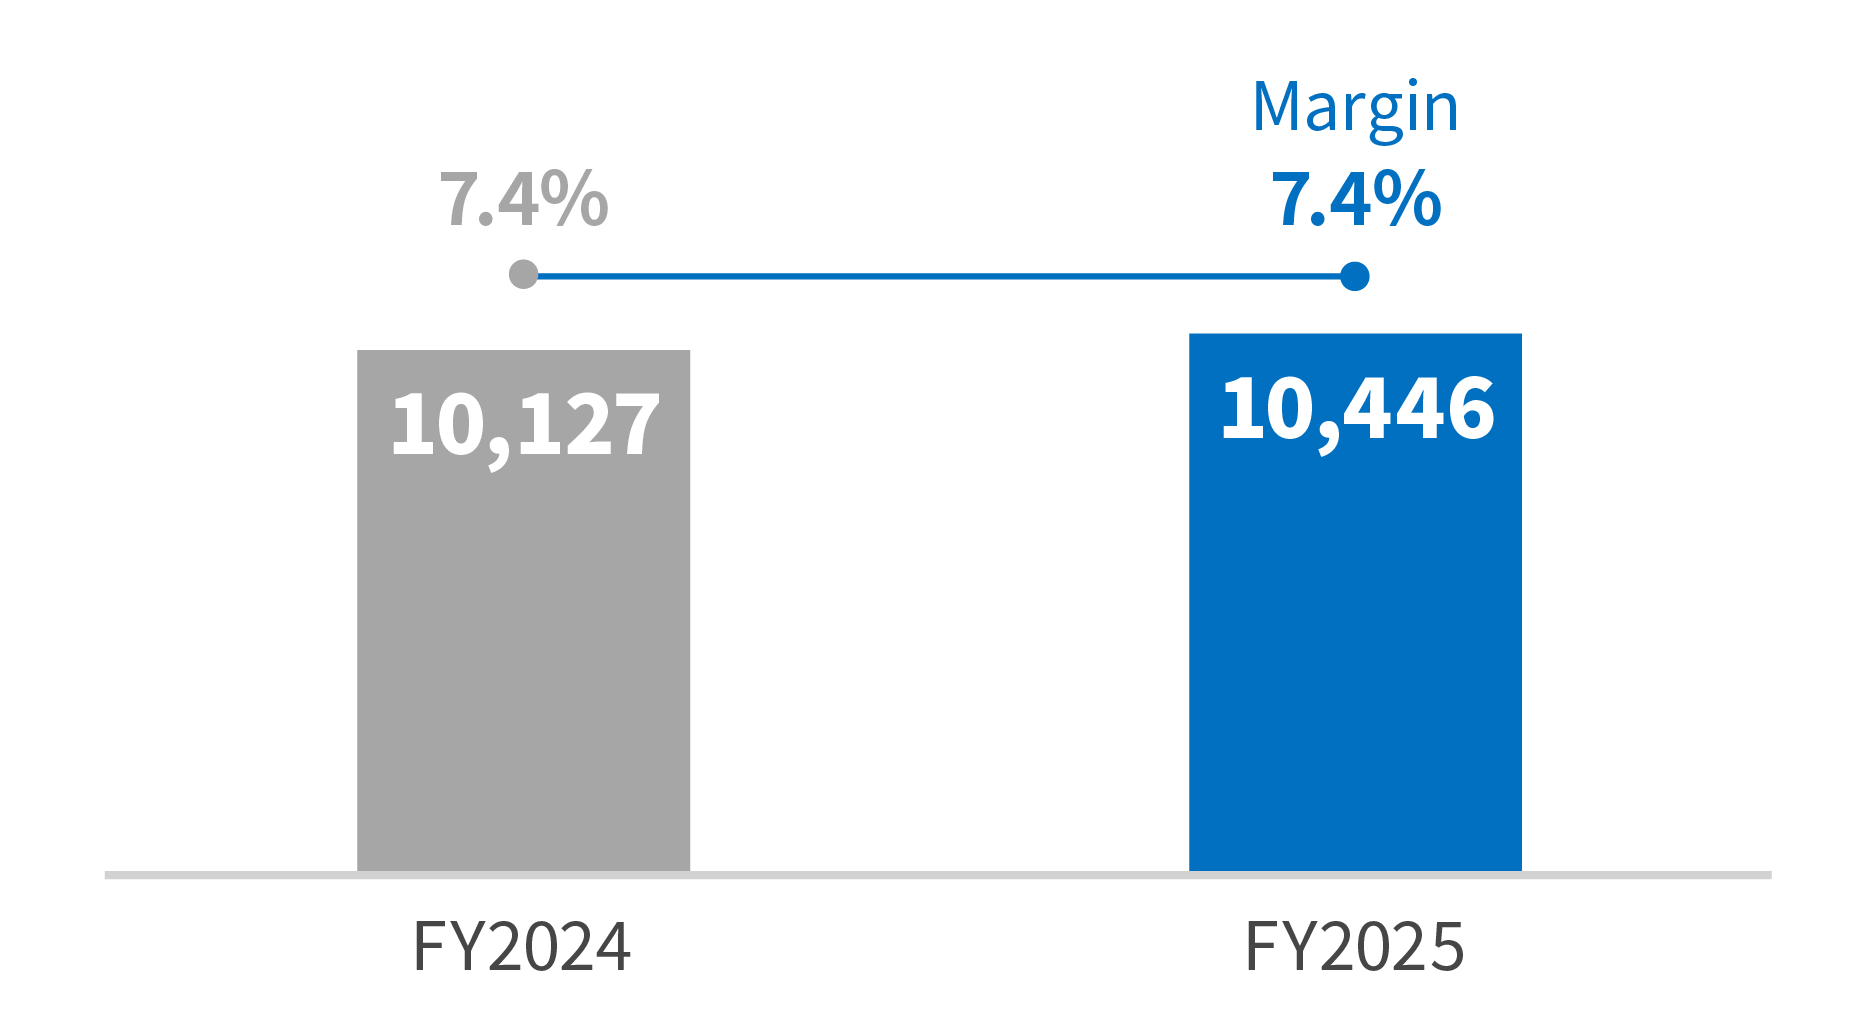
EBITDA increased 3.2% year on year to 10,446 million yen.
- Ordinary Profit
-
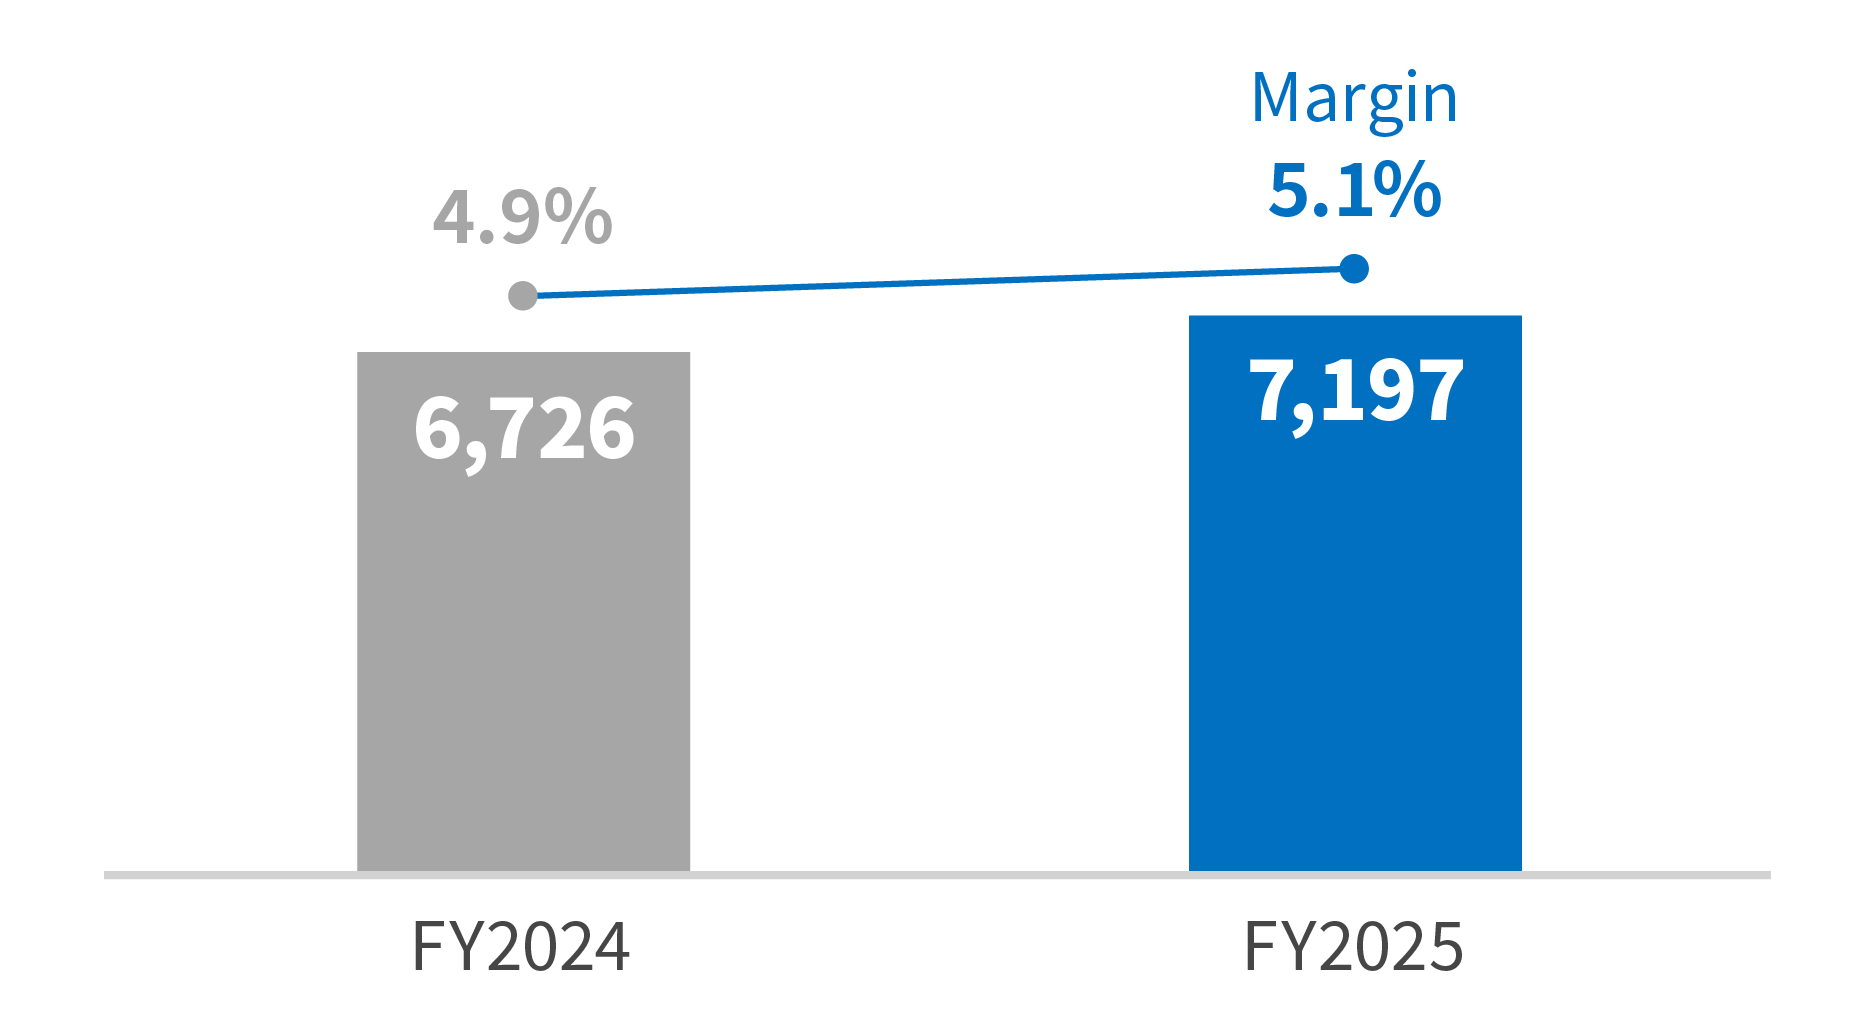
Ordinary profit increased 7.0% year on year to 7,197 million yen.
- Net Income
-
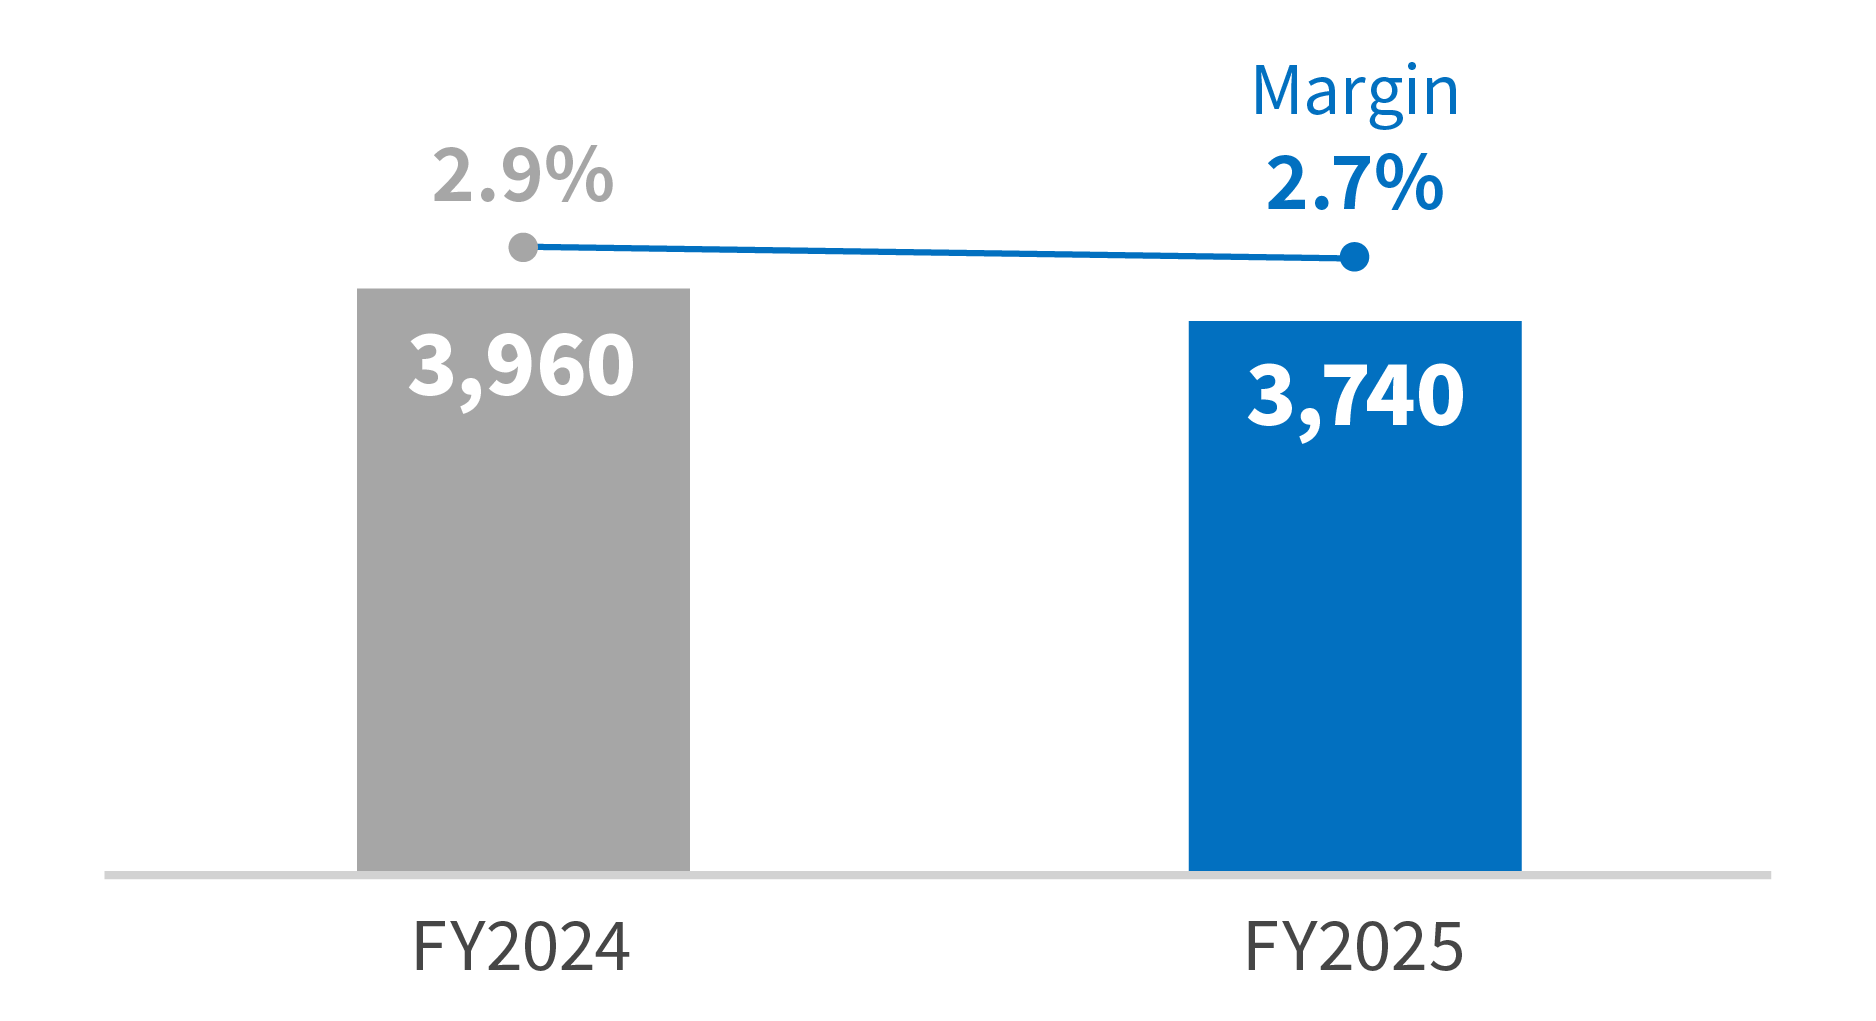
Net income decreased 5.6% year on year to 3,740 million yen.
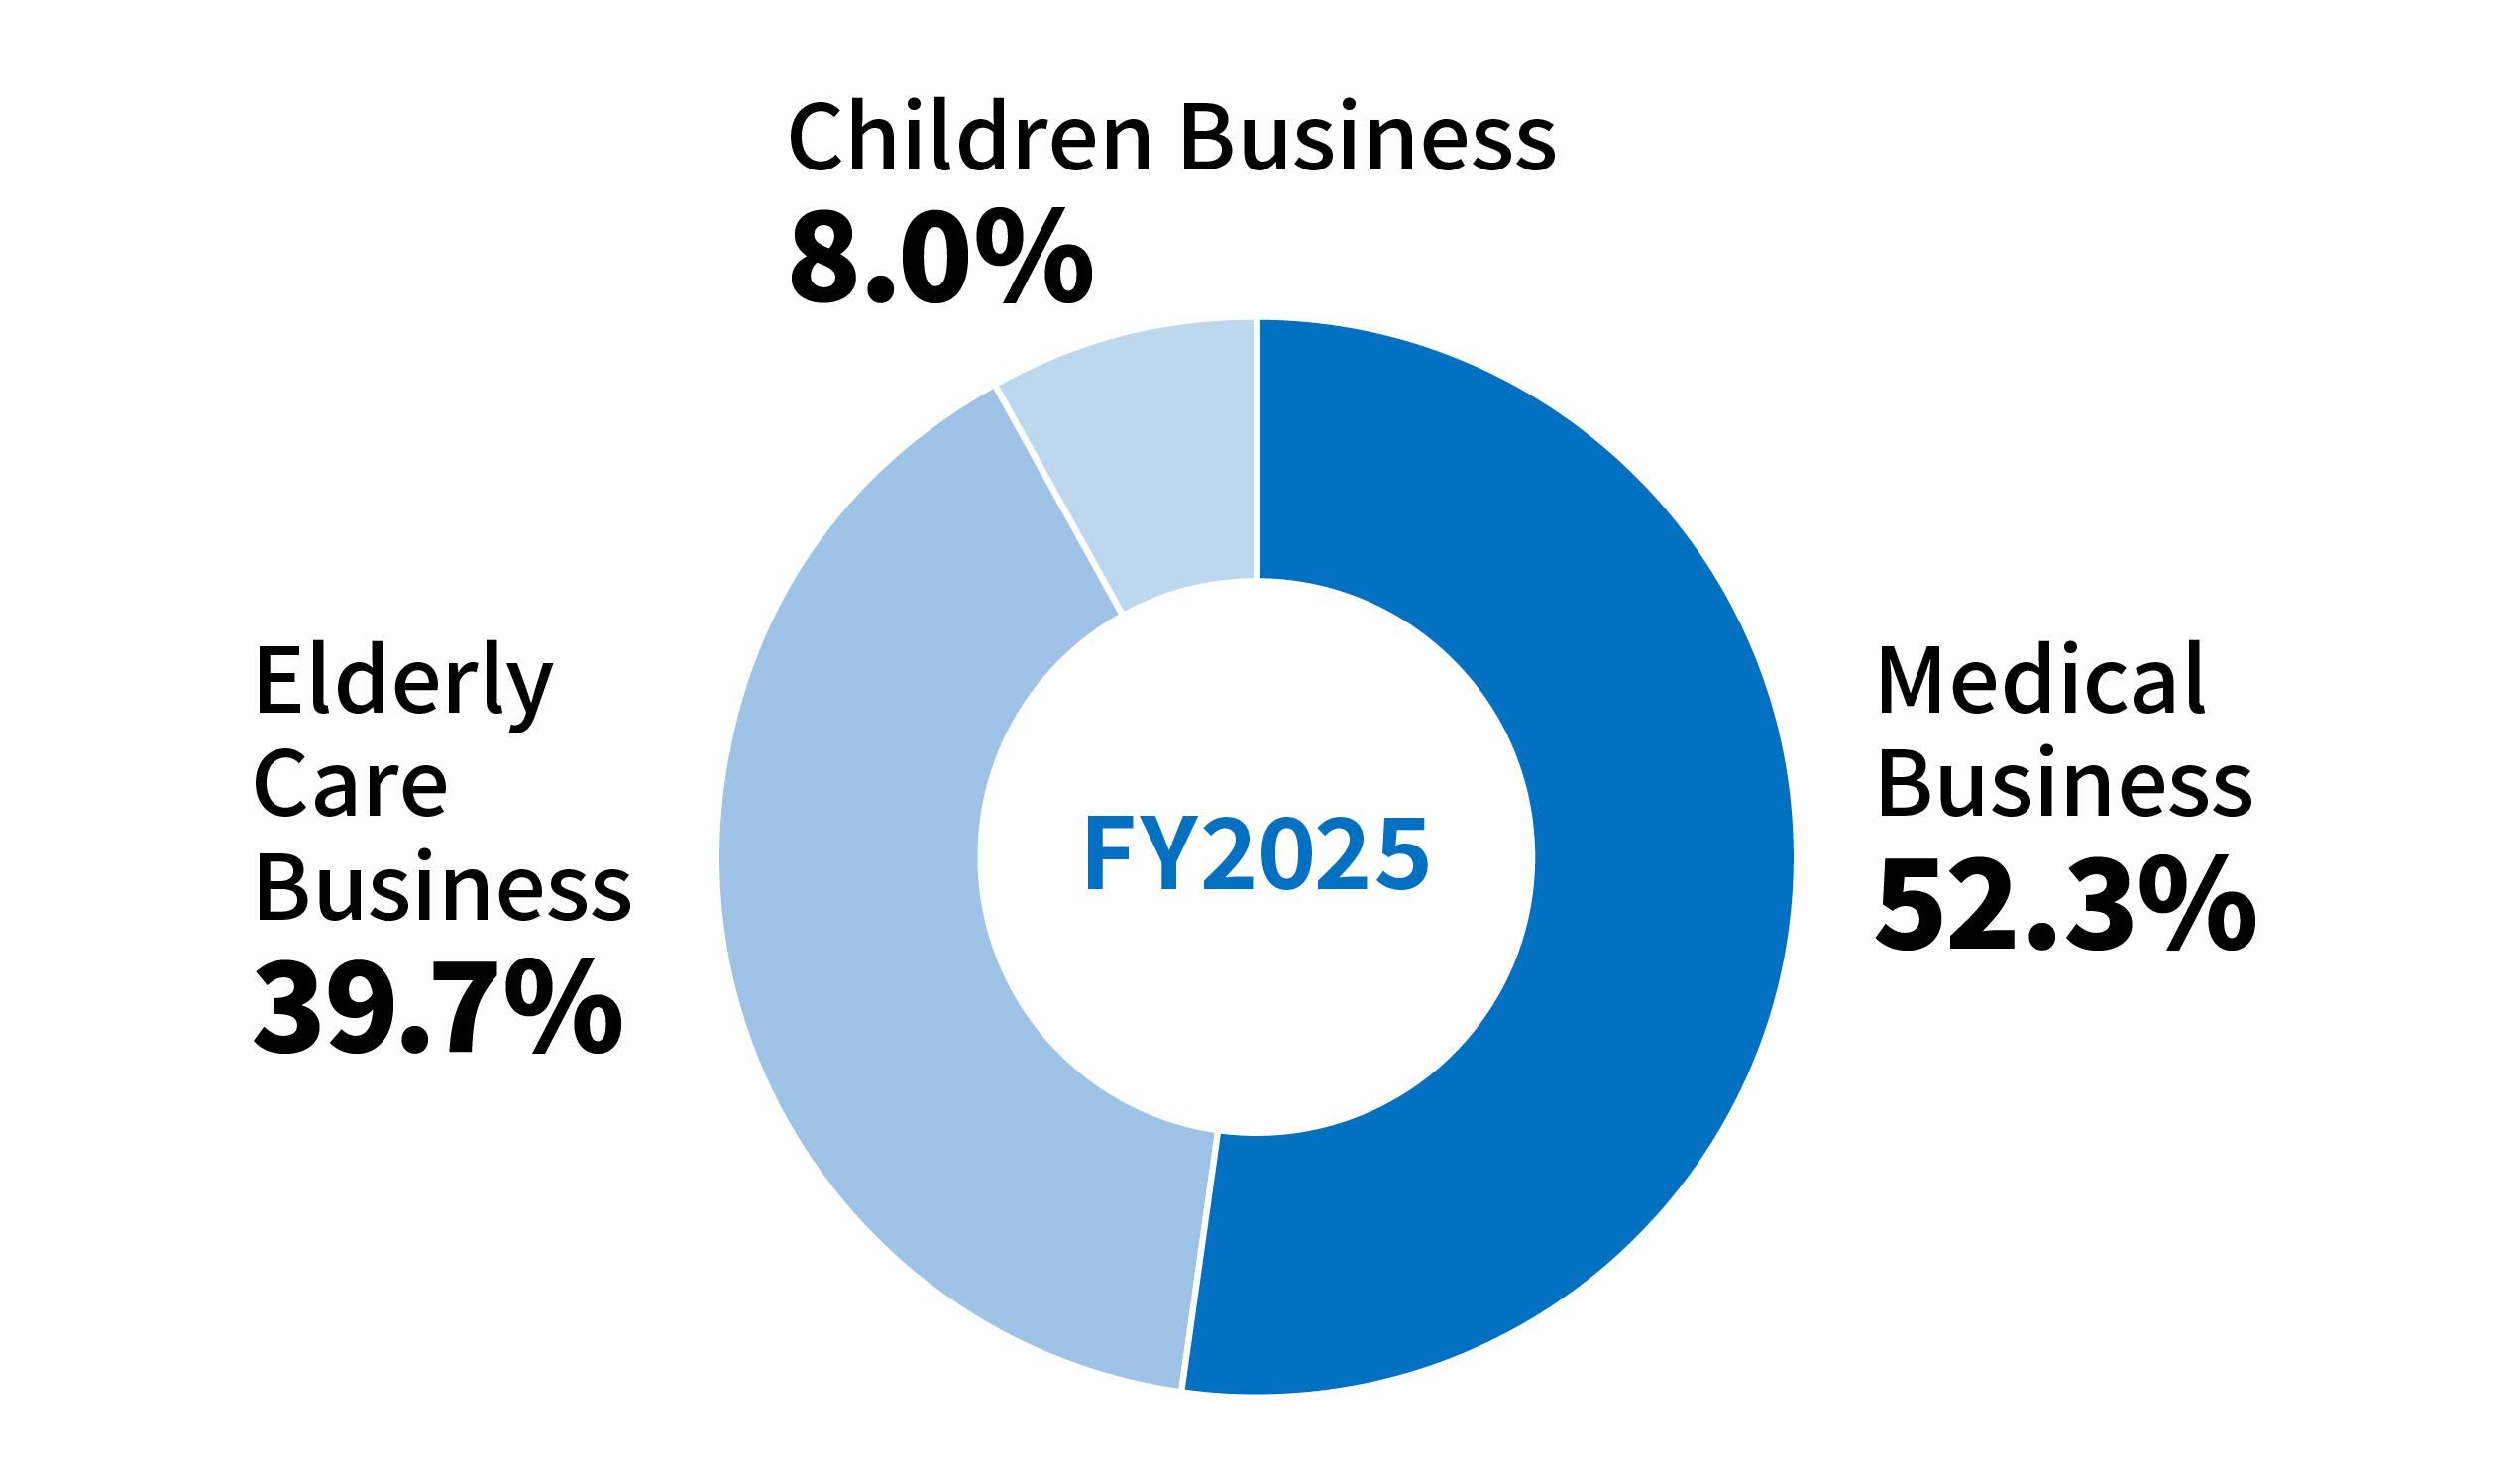
2.Consolidated Business Results by Business Segment (FY2025)
- Sales
- Medical Business
-
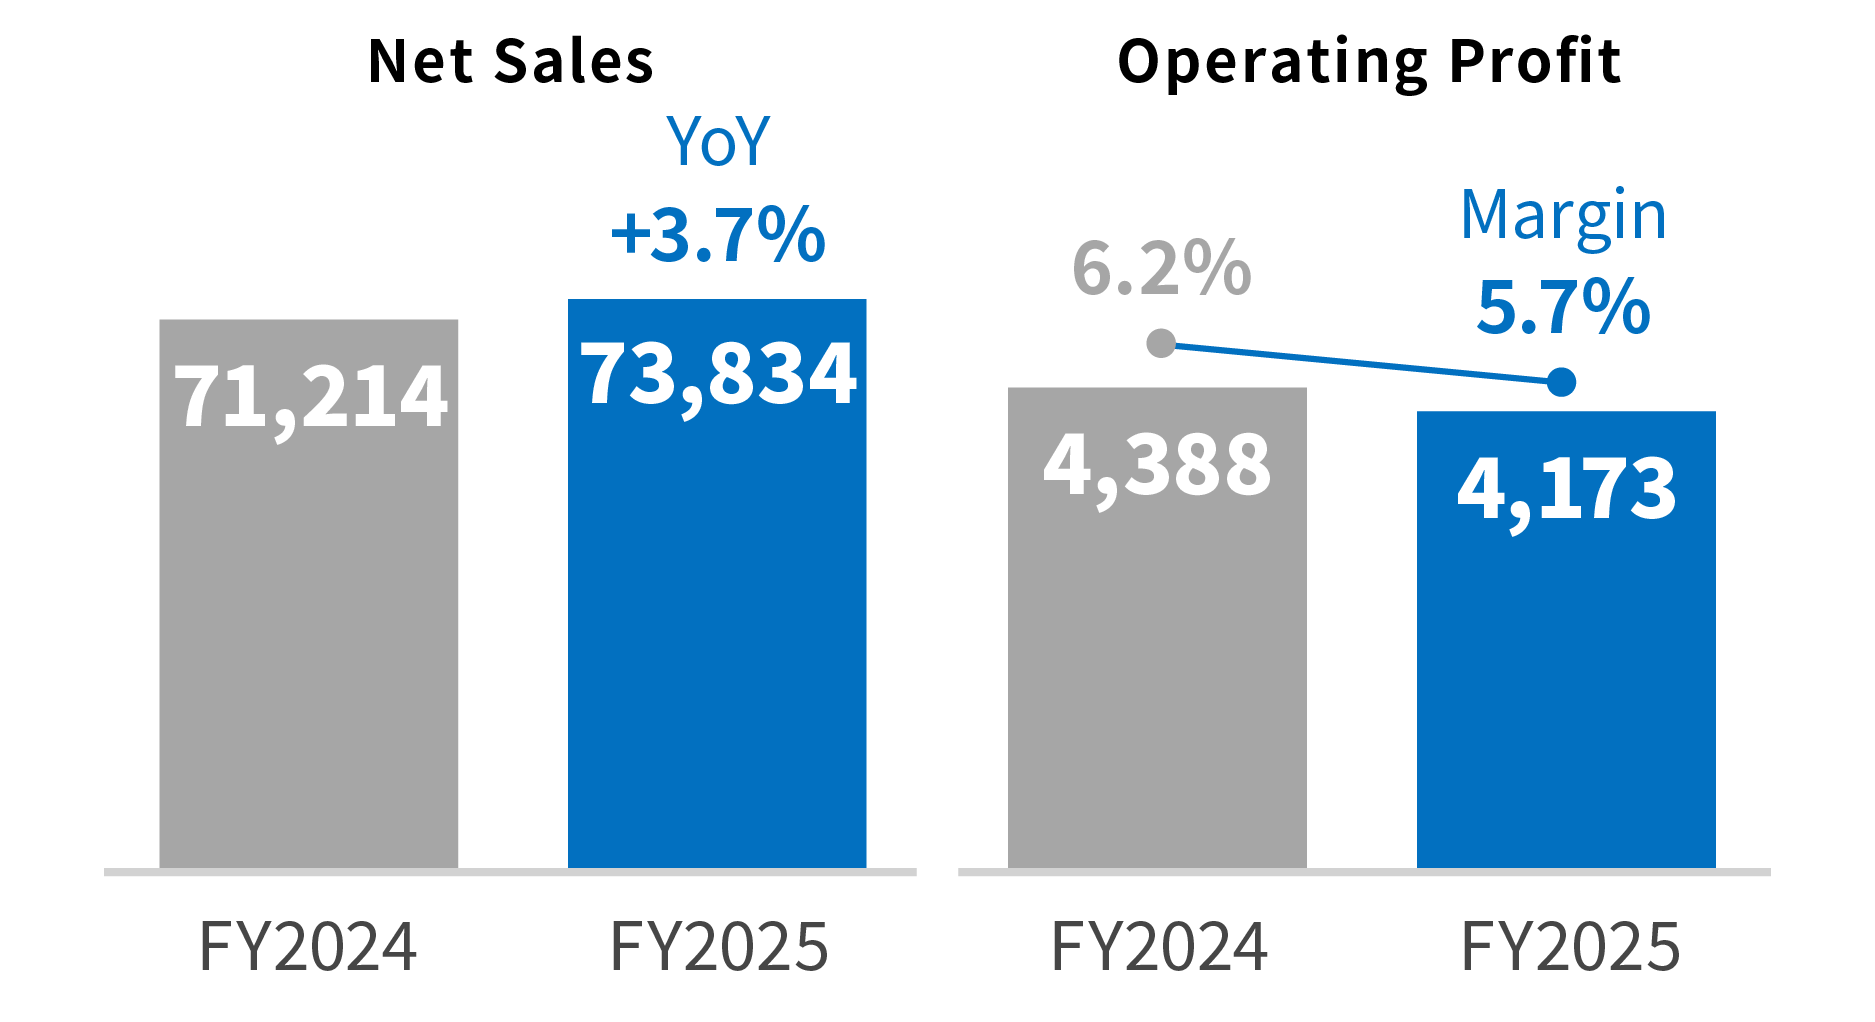
Net sales increased 3.7% year on year to 73,834 million yen, mainly because negotiations for price revisions in existing contracted services progressed more than in the previous year. Operating profit decreased 4.9% year on year to 4,173 million yen; while the effects of price revisions exceeded those of the previous year, the results reflected the enhancement of improvements in treatment for the purpose of investing in the development of human resources and increasing employee satisfaction, as well as new IT investments.
- Elderly Care Business
-
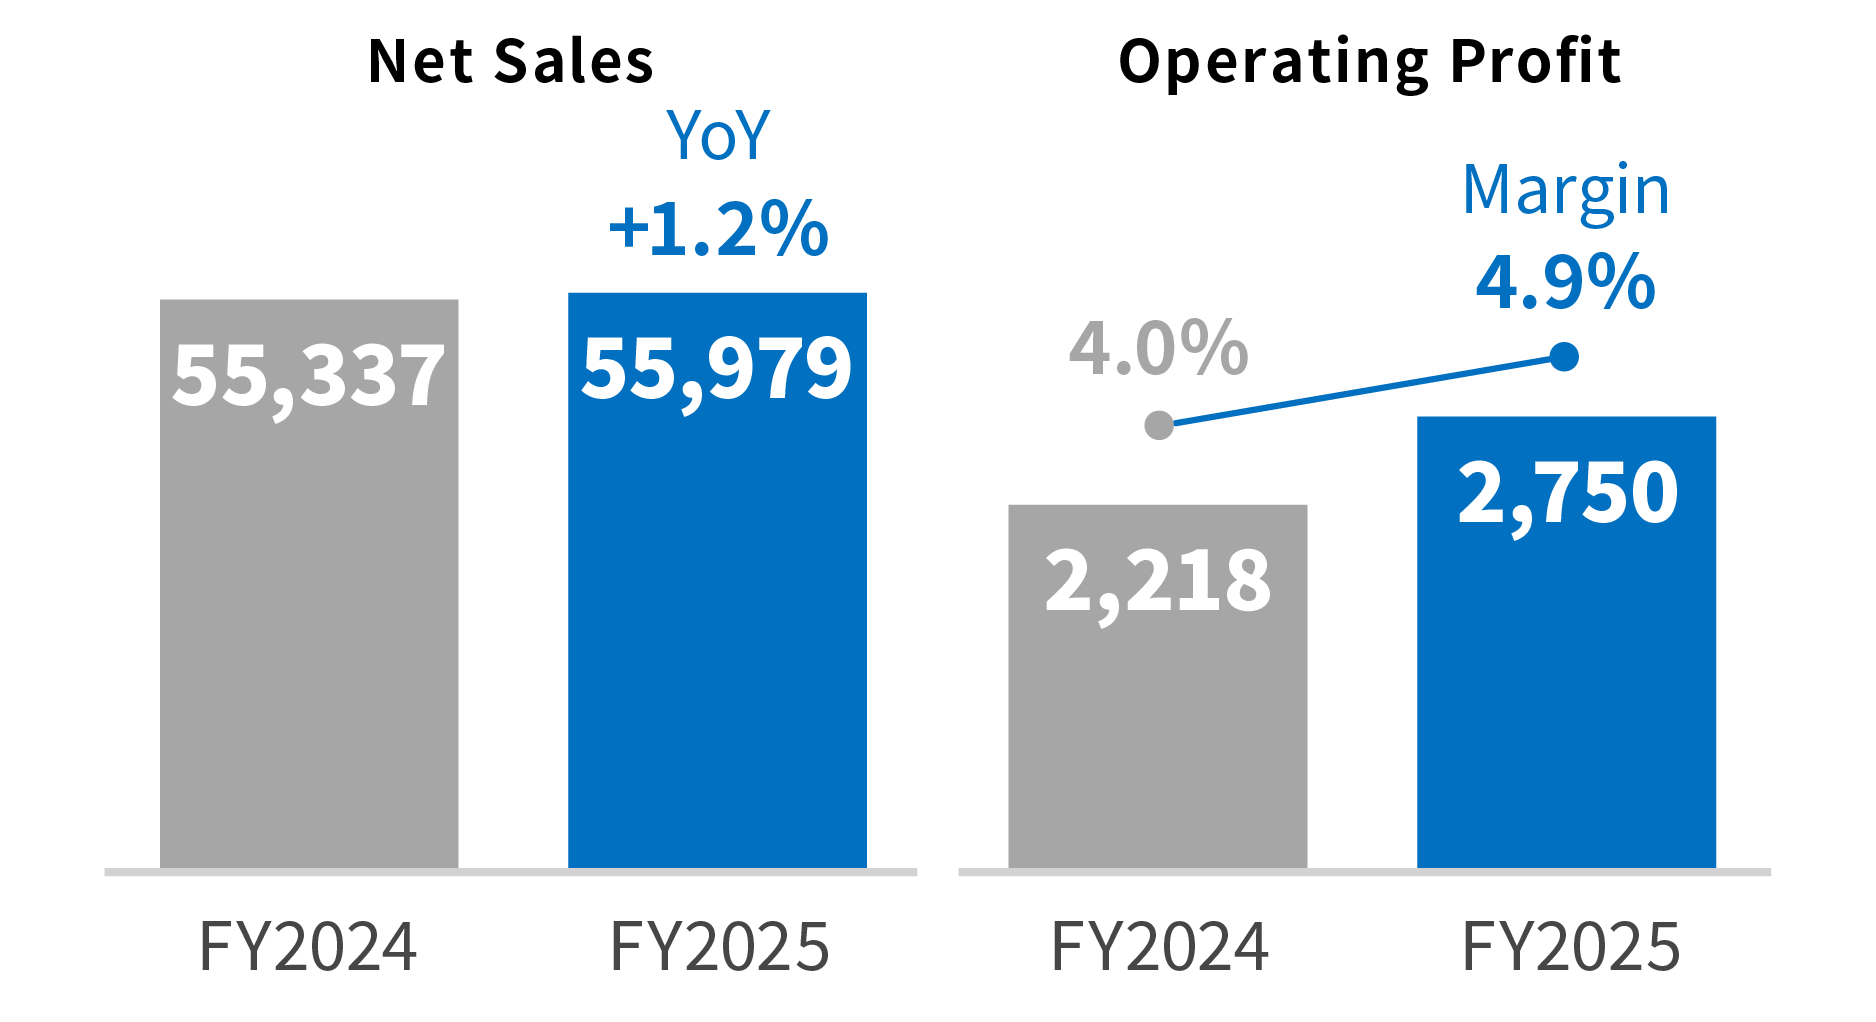
Net sales increased 1.2% year on year to 55,979 million yen, reflecting steady day service operations and solid occupancy rates in facility-based services. Operating profit grew significantly to 2,750 million yen, up 24.0% year on year; while affected by the soaring cost of living including utilities and food expenses, this increase was primarily due to higher profits from the sales increase, reduction of various selling, general and administrative expenses, and reduction of the cost of outside workers such as temporary staff.
- Children Business
-
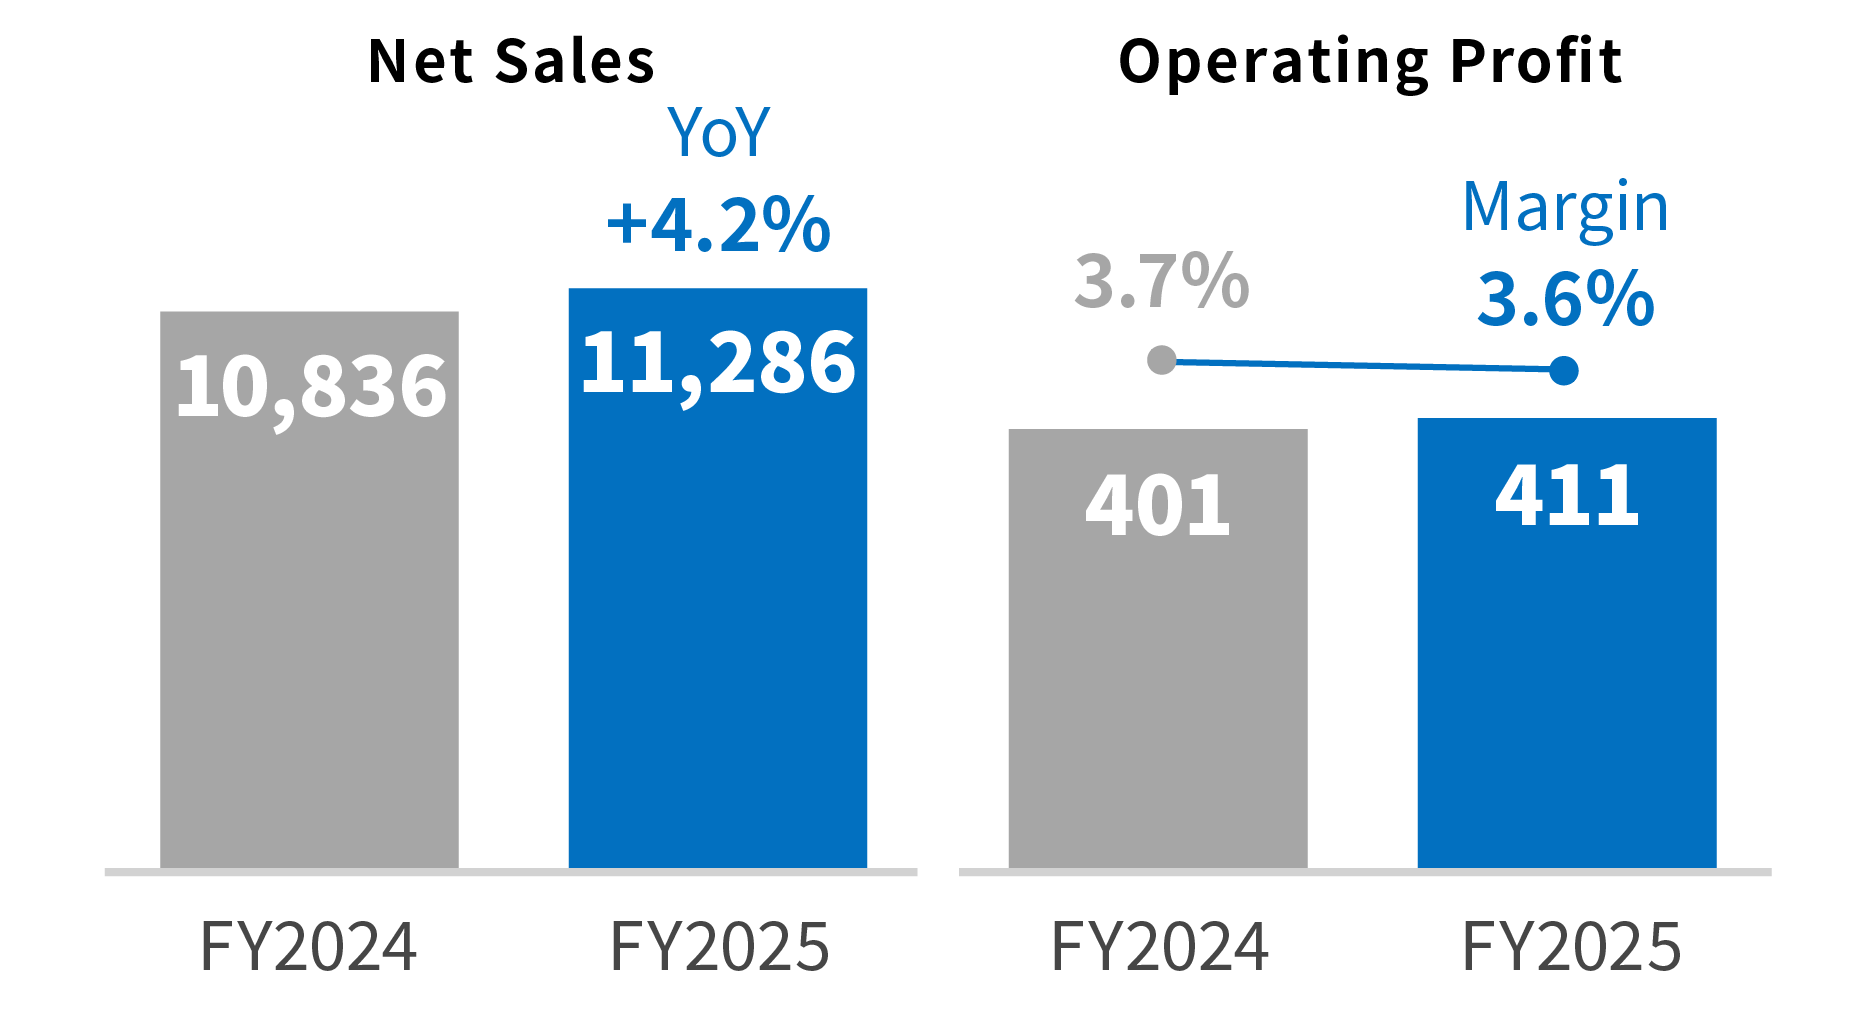
Net sales increased 4.2% year on year to 11,286 million yen, mainly due to a rise in unit prices following the revision of official prices and the Tokyo Metropolitan Government’s program for free daycare for first children. Operating profit grew 2.5% year on year to 411 million yen; although affected by improvements in the treatment of childcare workers, increased recruitment costs to strengthen staffing, and higher facility expenses such as utilities, these were offset by the positive effects of the increase in sales.
3.Financial Condition(March 31, 2026)
- Assets
-
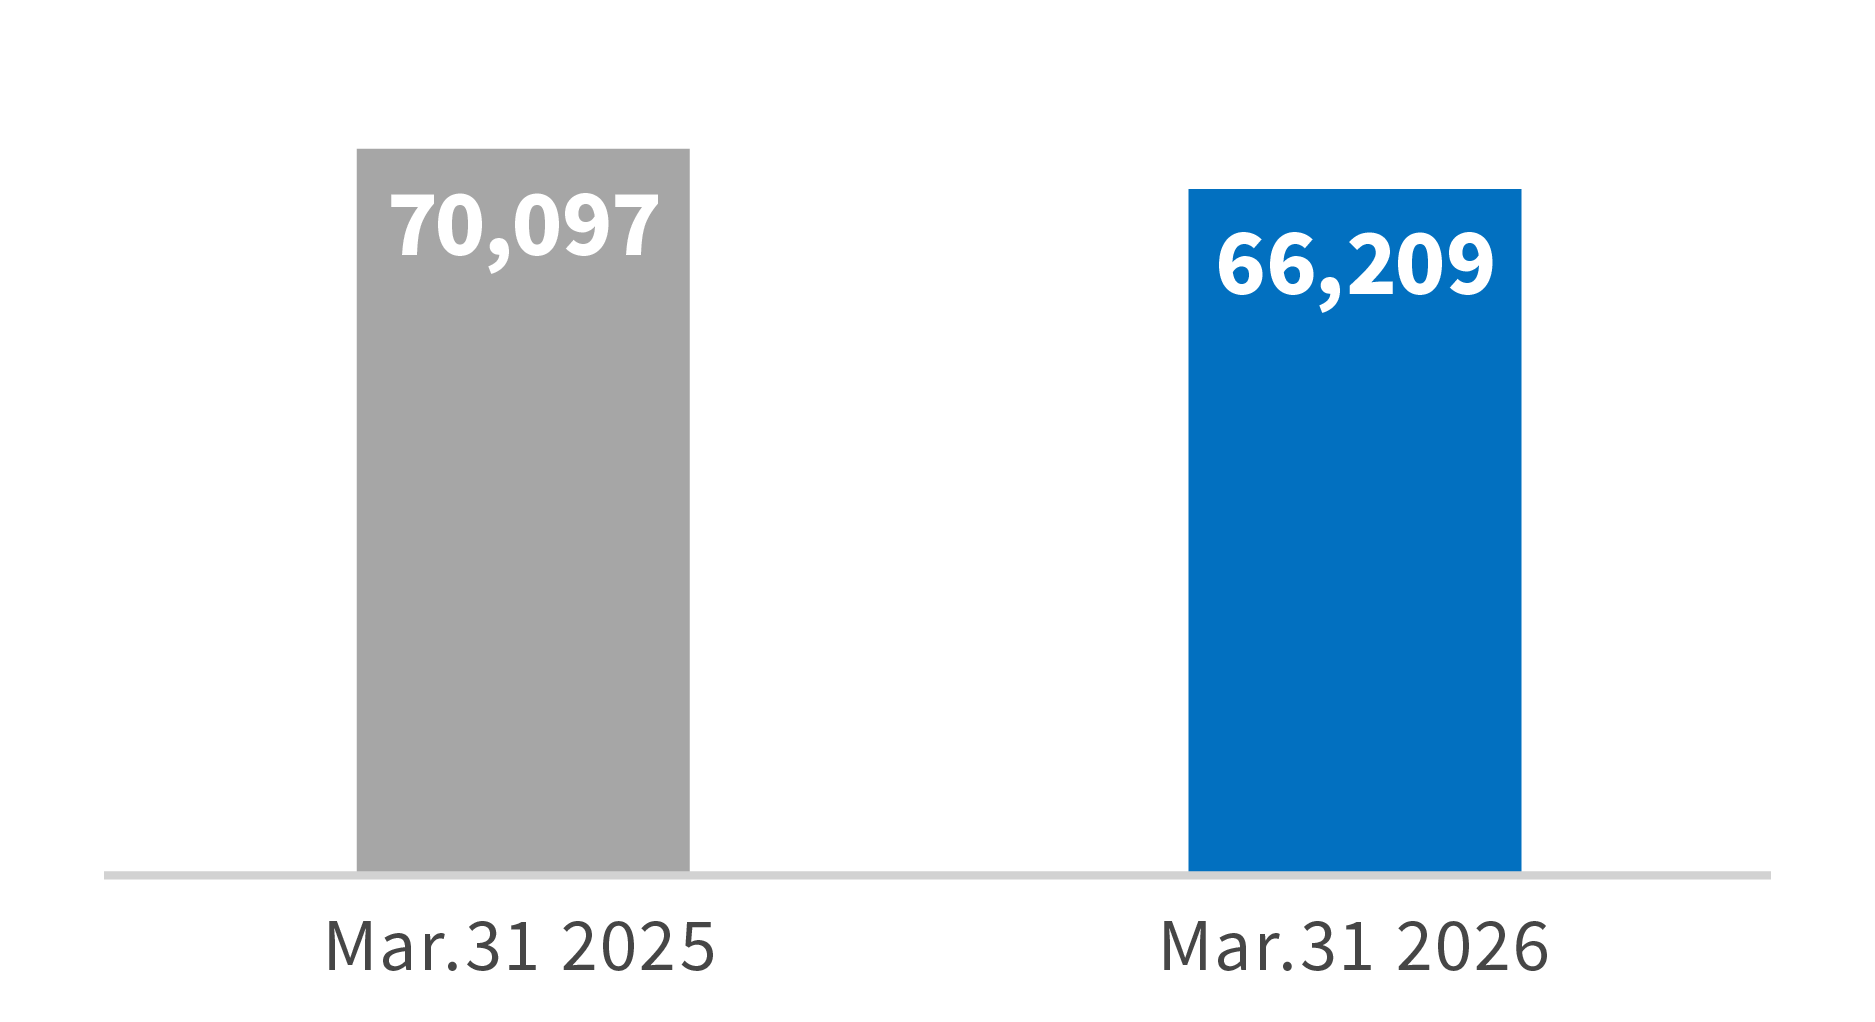
Current assets as of the end of the fiscal year under review were 30,270 million yen, a decrease of 895 million yen compared to the end of the previous fiscal year. This was mainly due to a decrease of 1,791 million yen in cash and deposits. Fixed assets were 35,938 million yen, a decrease of 2,992 million yen compared to the end of the previous fiscal year, primarily due to a decrease in goodwill of 2,226 million yen.
- Liabilities
-
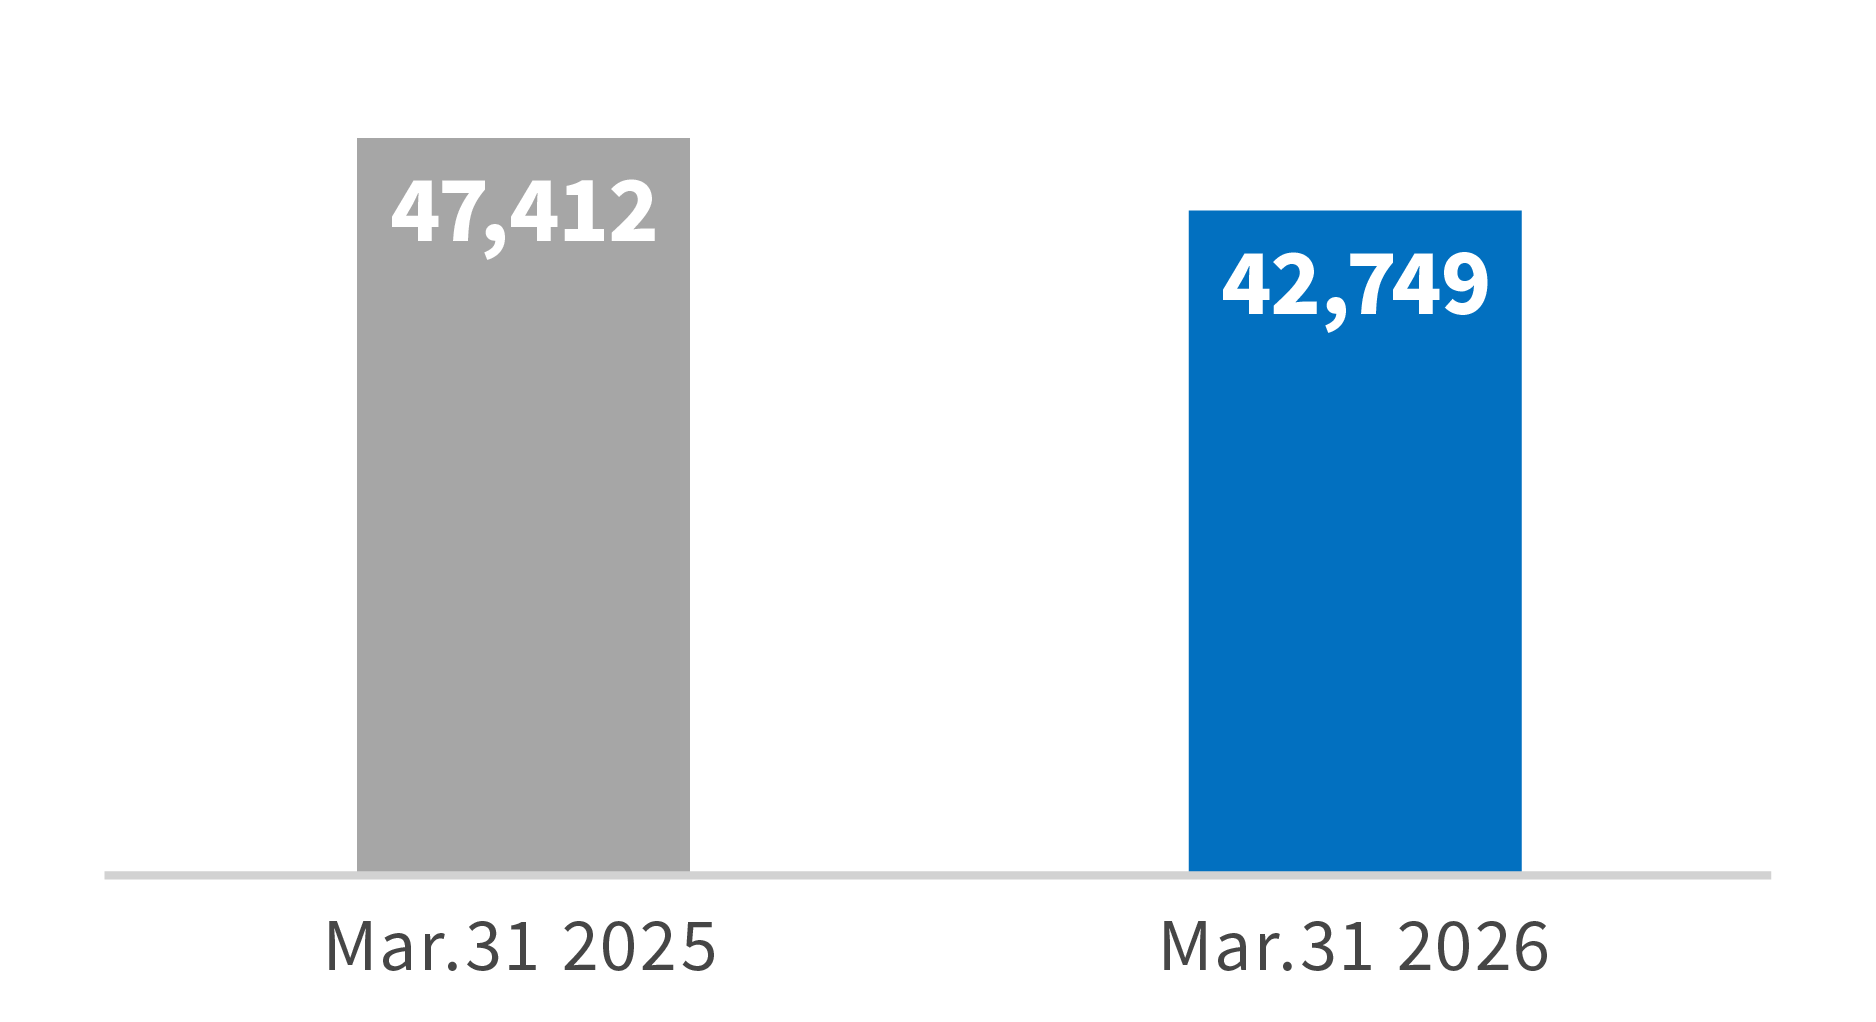
Current liabilities were 22,605 million yen, an increase of 243 million yen year on year, mainly due to an increase of 276 million yen in provision for bonuses. Long-term liabilities were 20,143 million yen, a decrease of 4,907 million yen, primarily reflecting a decrease of 4,782 million yen in long-term debt. Total liabilities amounted to 42,749 million yen, a decrease of 4,663 million yen.
- Net Assets
-
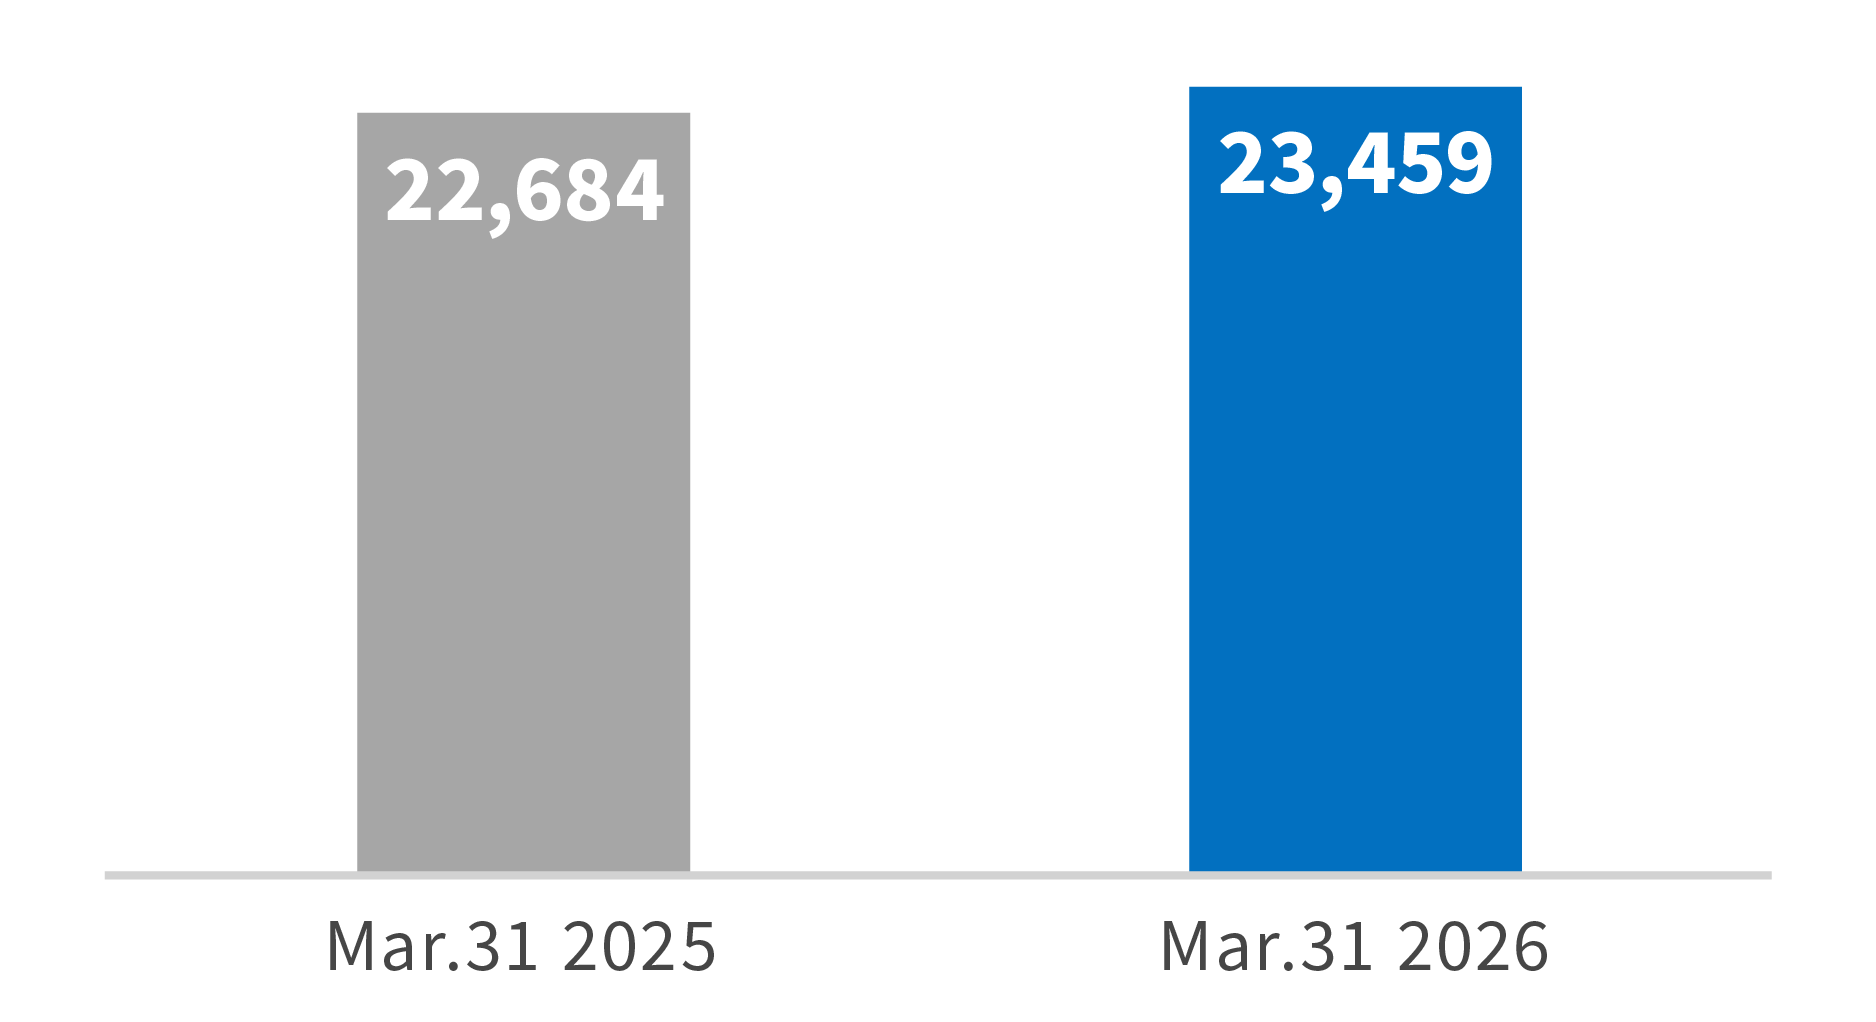
Net assets were 23,459 million yen, an increase of 775 million yen compared to the end of the previous fiscal year. This was mainly due to net income attributable to owners of parent of 3,740 million yen, partially offset by dividends paid of 1,932 million yen.
4.Cash Flows(FY2025)
- Net cash provided by operating activities
-
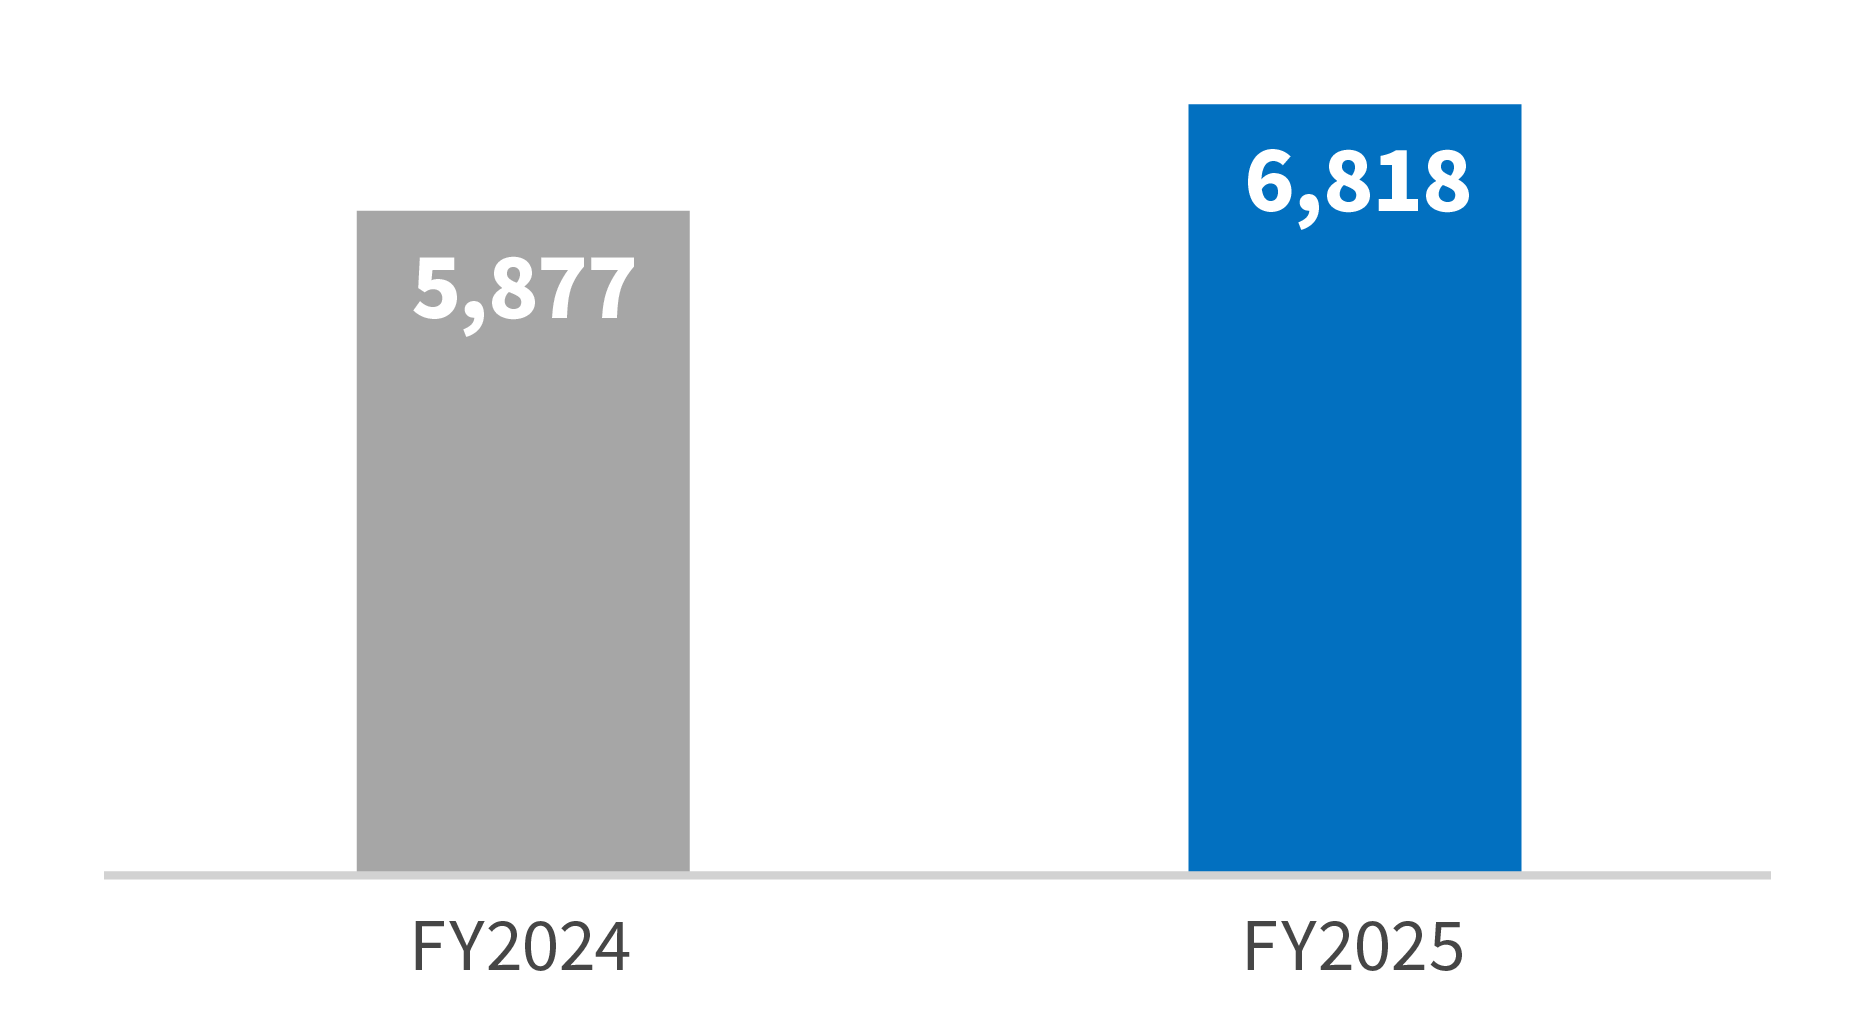
Net cash provided by operating activities amounted to 6,818 million yen. This was mainly due to income before income taxes of 6,358 million yen, amortization of goodwill of 1,640 million yen, depreciation of 1,459 million yen, and income taxes paid of 2,456 million yen.
- Net cash used in investing activities
-
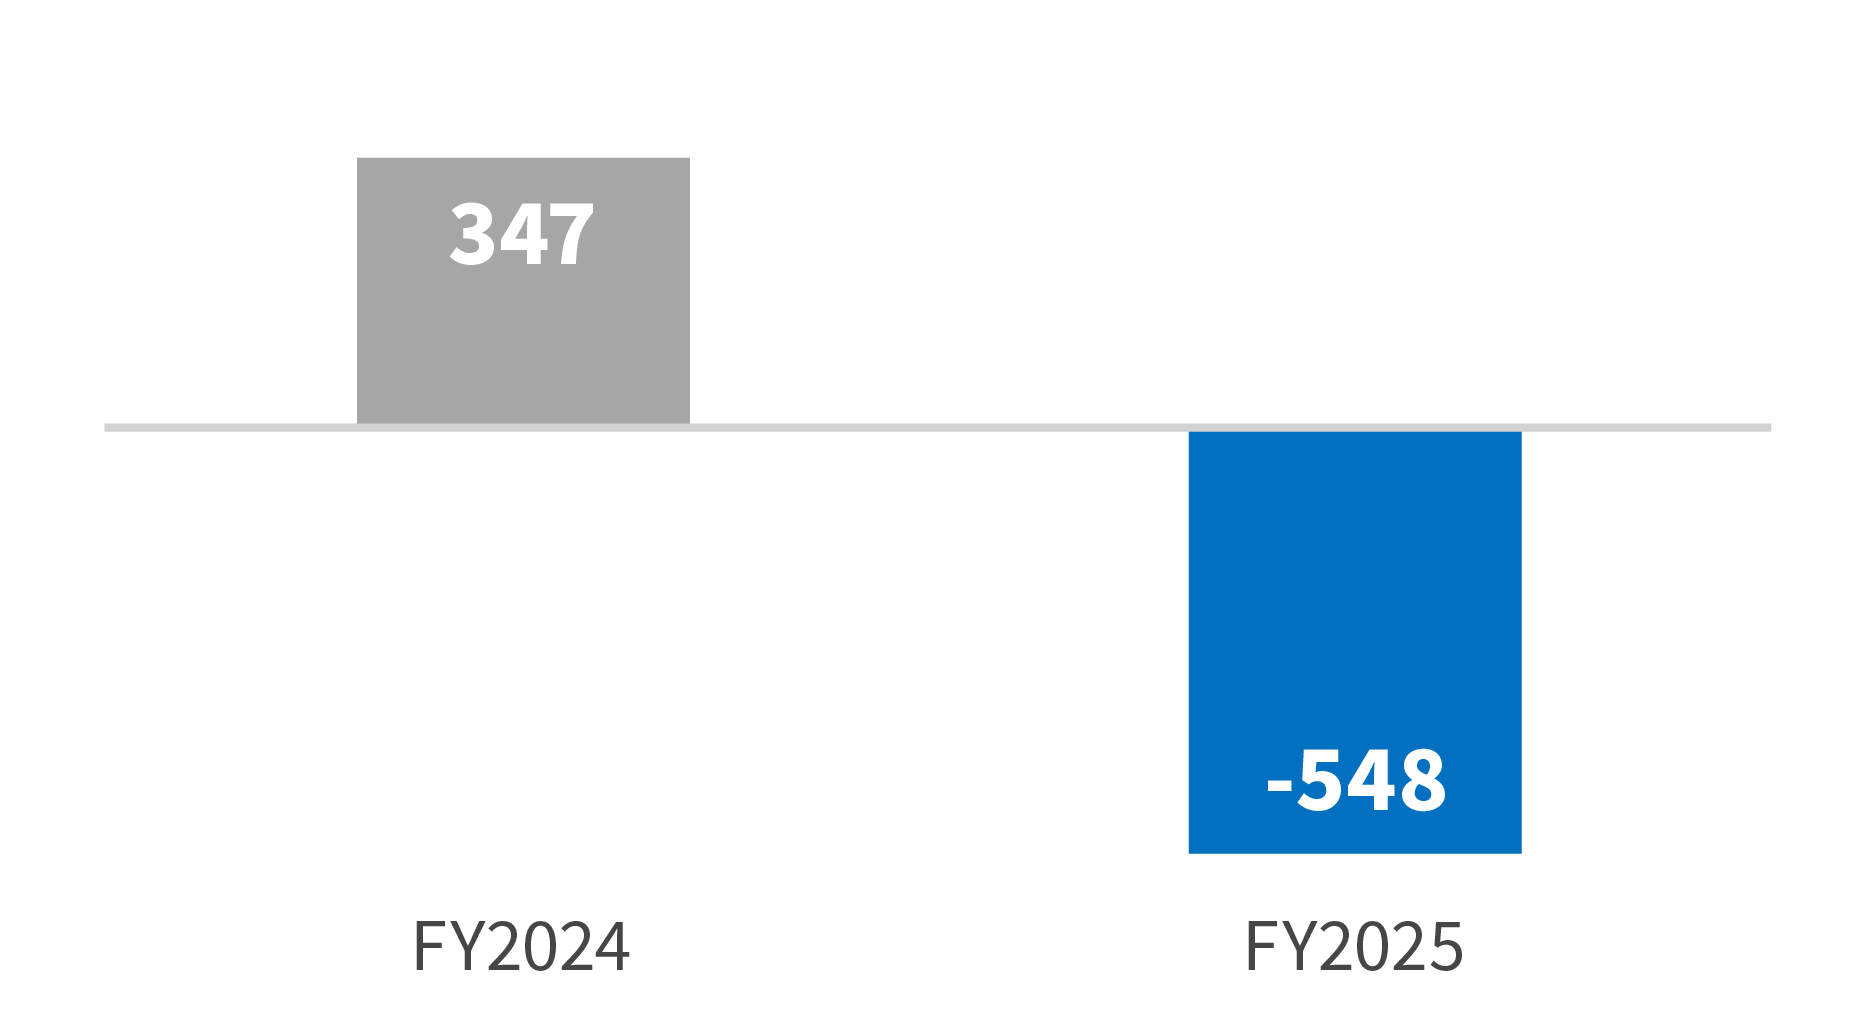
Net cash used in investing activities was 548 million yen. This primarily reflected purchase of intangible assets of 496 million yen and purchase of property, plant and equipment of 297 million yen, partially offset by proceeds from redemption of investment securities of 310 million yen.
- Net cash used in financing activities
-
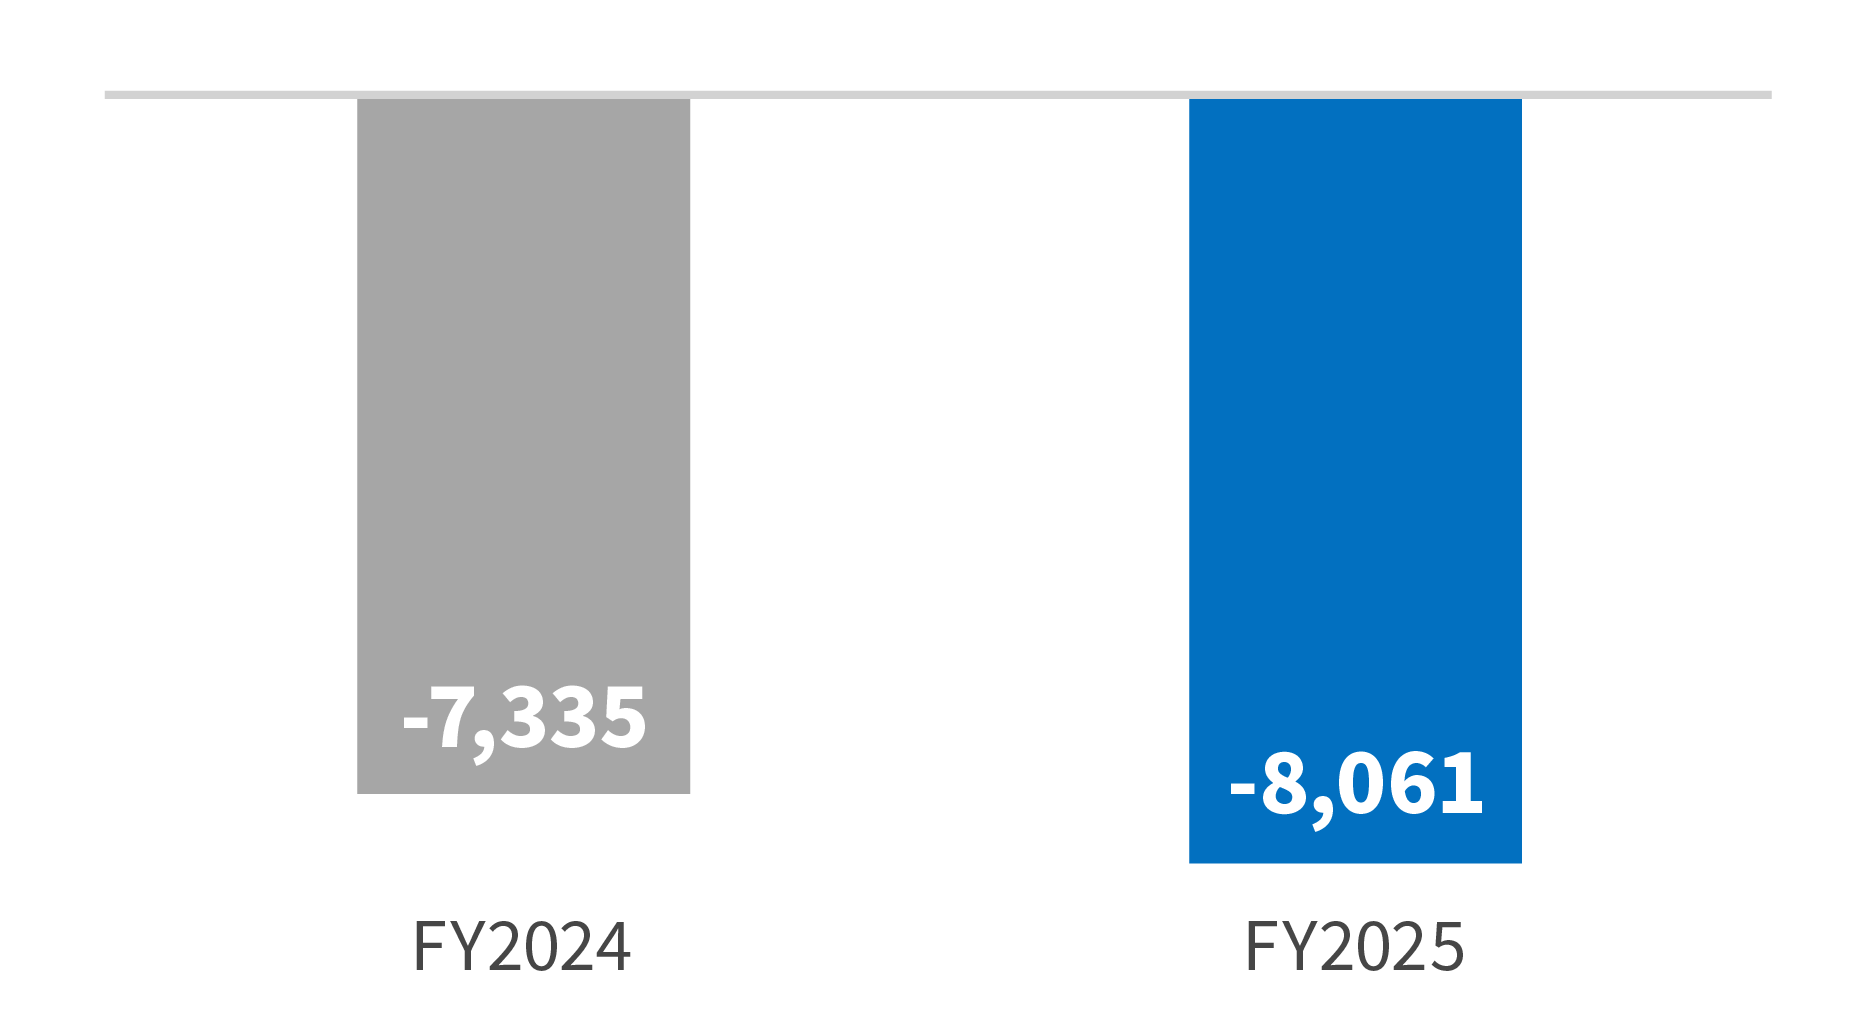
Net cash used in financing activities was 8,061 million yen, mainly due to repayments of long-term borrowings of 4,782 million yen and dividend payments of 1,932 million yen.
- Cash and cash equivalents at end of period
-
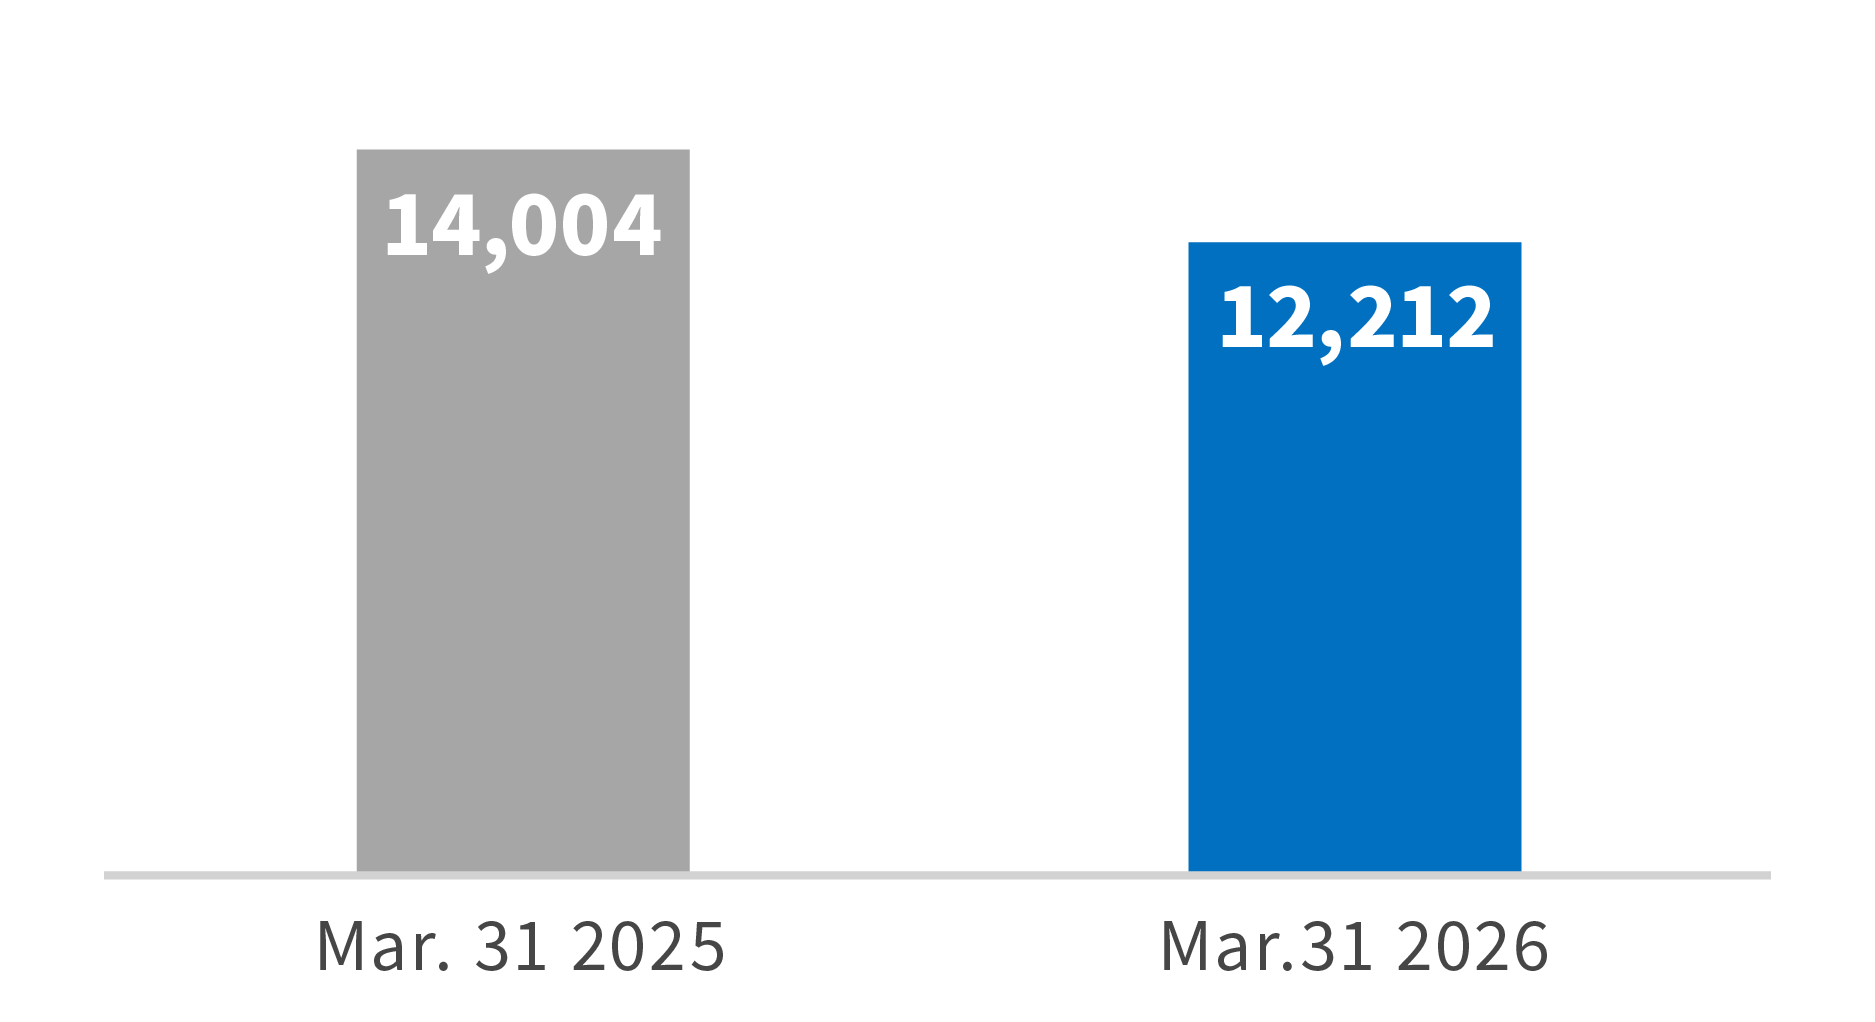
Cash and cash equivalents at the end of the fiscal year under review reached 12,212 million yen, a decrease of 1,791 million yen from the end of the previous fiscal year. Although income before income taxes was 6,358 million yen, this decrease was primarily due to repayments of long-term borrowings, income taxes paid, and dividend payments.